Send to a Friend Send to a Friend
Creating an Indigo DRS Reports
Indigo DQM Data Management System uses the Indigo DRS Data Reporting System
to create advanced reports and documents.
Indigo DRS is an advanced reusable reporting and document generation platform
that gives the best functionality and compatibility with advanced reporting
features and effortless integration of this technology into your projects you
can be assured of having the best reporting capabilities.
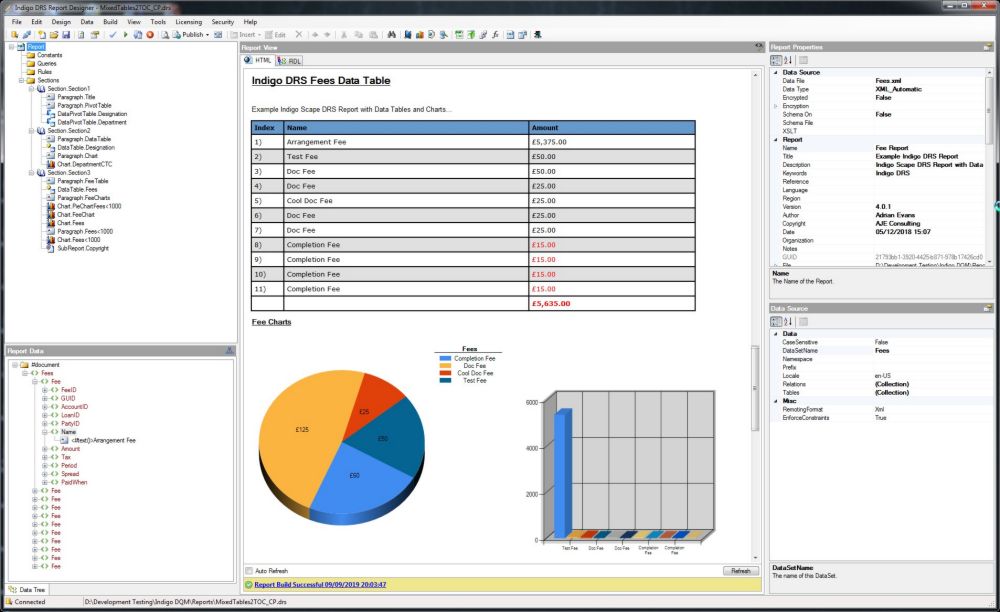
The optional Indigo DRD Report
Designer Tool , not included, uses Indigo DRS RDL (Report Description Language)
with advanced reporting capabilities complex Data can be presented in a visual
and meaningful format. The report designer can quickly create advanced HTML
reports rich in content. Tables and Charts can be added to the report effortlessly
allowing complex data to be presented with the minimum of effort.
Data Management Tools
The Data Management Tools contains shortcuts to the most commonly used Tools
of the system for user convenience.
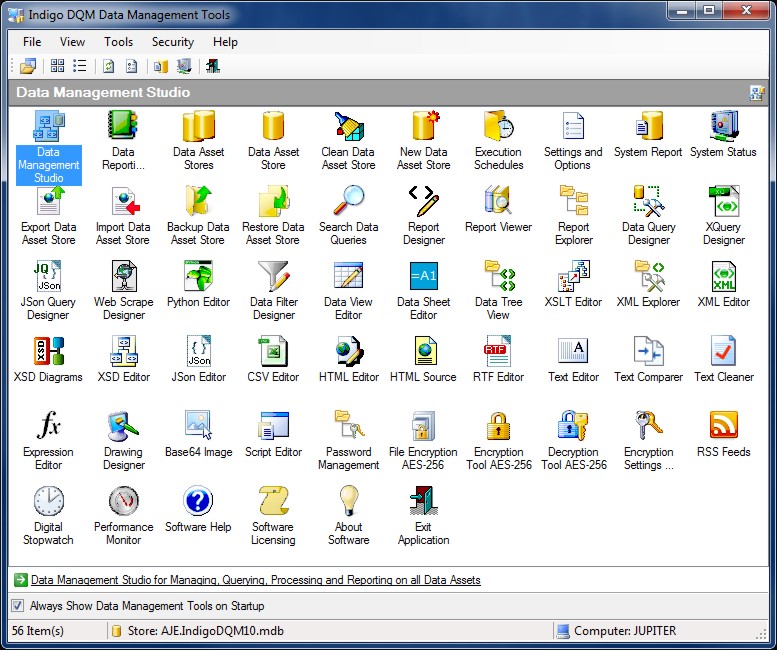
To use Indigo DRS Report Designer Tool in Indigo DQM please download and install
Indigo DRD. After successful installation the Icon will appear on the Data Management
Tools screen.
Indigo DRS reports give the best functionality and compatibility and because
they use standard HTML for reporting the reports can be displayed on any type
of device and in any type of browser.
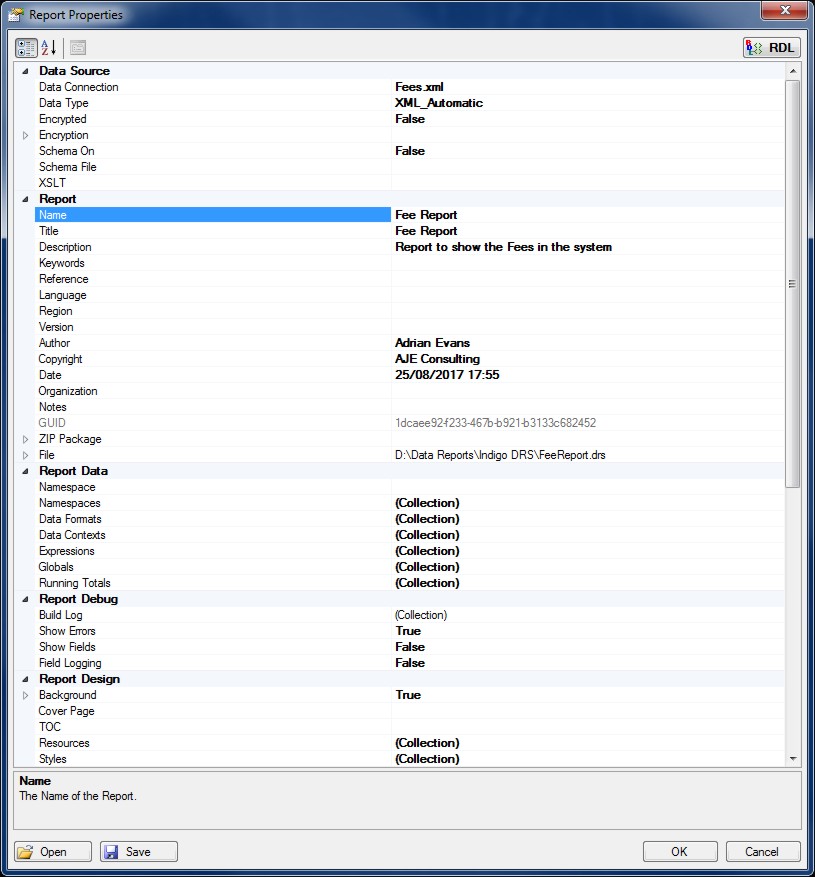
Open a new Report and define the Data Source and Report Properties
To define the Report Data Source open the Report Properties dialog or select
the Report Node and edit the properties in the Property Grid.
The Report Data Source is a Dataset in the form of XML Data. By default the
Report Designer will automatically look for a Schema XSD File and apply it to
the Data Source. An XSD File can also be specified for the Data Source in the
report properties. If the Designer cannot find an XSD File the Report Data Schema
will be inferred as a typed Schema from the Report Data XML.
The Data Source File and Schema defined in the Report Designer are only used
in Design mode. When a Report is run against a Data Command or an Execution
Plan the Result Data and Schema will be used from the Data Command or Execution
Plan respectively.
Reports can be defined with a background Image so for example if a particular
report is a draft then background image can be defined to indicate this.
Report CSS
Cascading Style Sheets (CSS) is a style sheet language used for describing
the look and formatting of a document written in a markup language such as HTML.
CSS is designed primarily to enable the separation of document content from
document presentation, including elements such as the layout, colors, and fonts.
This separation can improve content accessibility, provide more flexibility
and control in the specification of presentation characteristics, enable multiple
HTML pages to share formatting by specifying the relevant CSS in a separate
.css file, and reduce complexity and repetition in the structural content.
It is recommended that Cascading Style Sheets are used on all Indigo DQM Reports.
Certain Report Items such as Tables and Paragraphs have a property to define
the Style Sheet Class from the CSS thus determining the appearance of that particular
Report Item.
Adding a Report Section
To Add a Report Section click on the Section Node of the Treeview and Click
Add. Report Sections are the main Content Containers for the Report and define
'New Sections' in the Report just like Chapters of a book. Sections can be defined
with a background Image so for example if a particular section of the report
is draft a background image can be defined to indicate this.
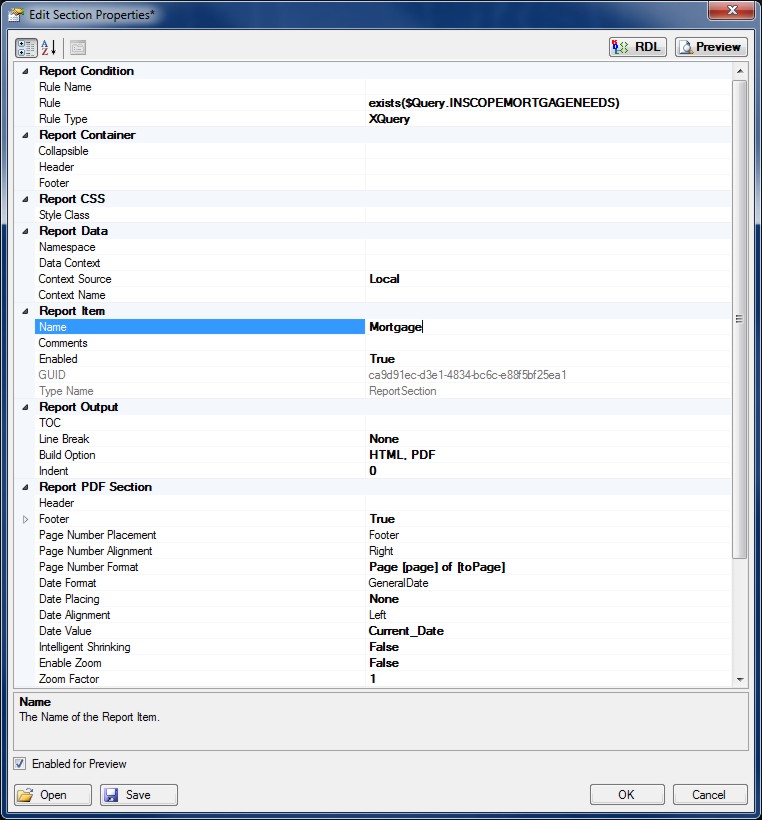
Report Sections can also contain Report Conditional Rules to determine if the
Section is displayed or not. Report Rules are XQuery expressions that return
True or False and determine if Content is Enabled. By Default if empty the Rule
will always be True.
Adding a Report Paragraph
To Add or Edit a Report Paragraph click on the Report Treeview and select the
Section or Group you wish to create a Paragraph in.
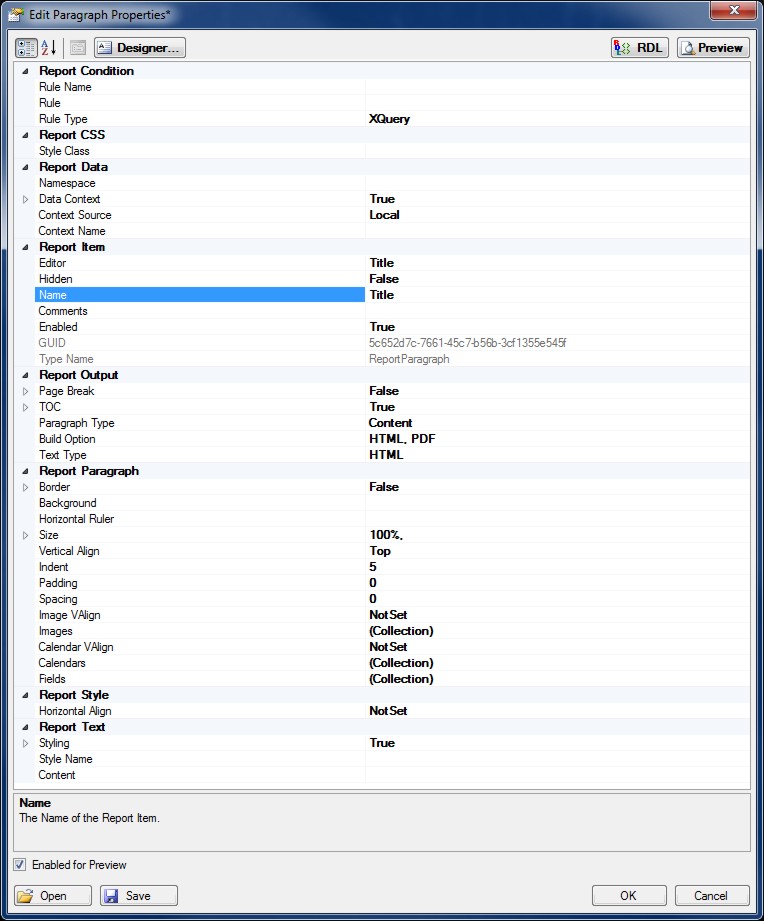
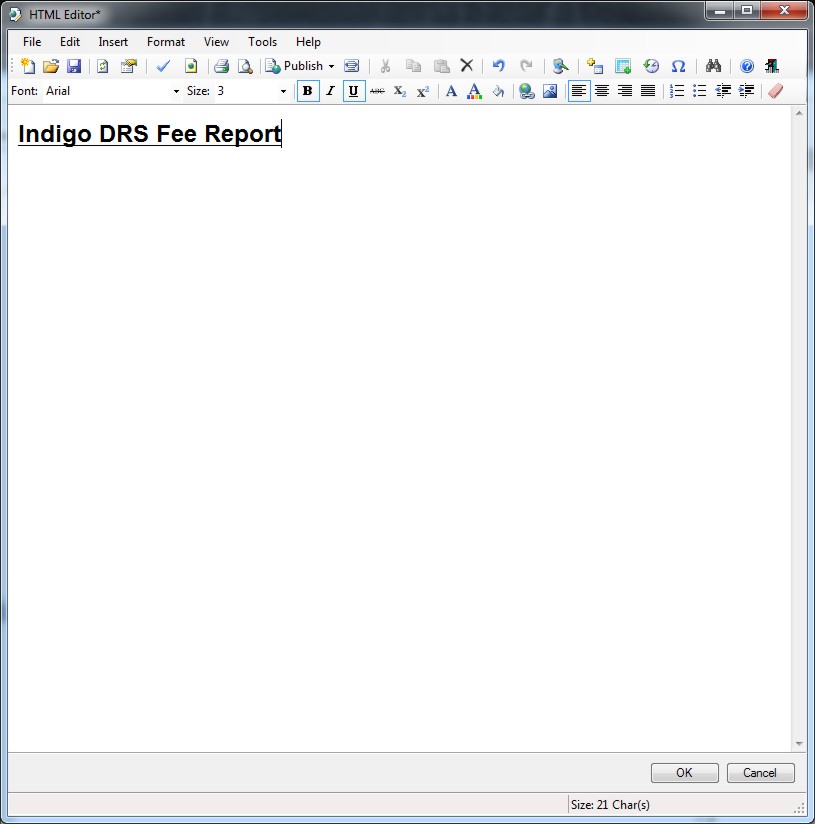
Enter the paragraph content using the HTML Content Editor.
Paragraphs can also contain Report XQueries to display Report Data. XQuery
can be used in the report to display data in the form of Report Fields.
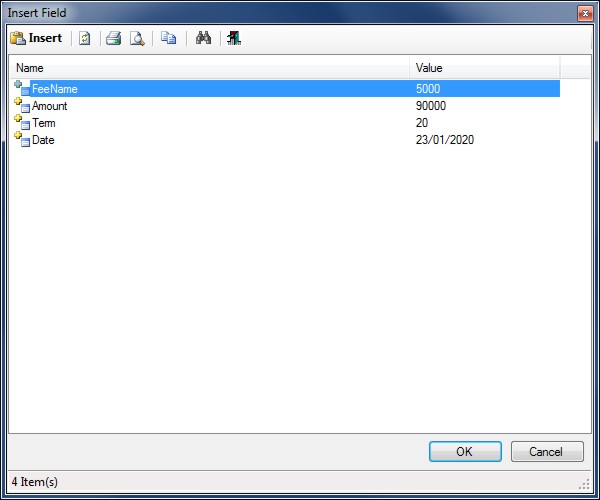
To Add a Report Field click the Fields Collection Editor.
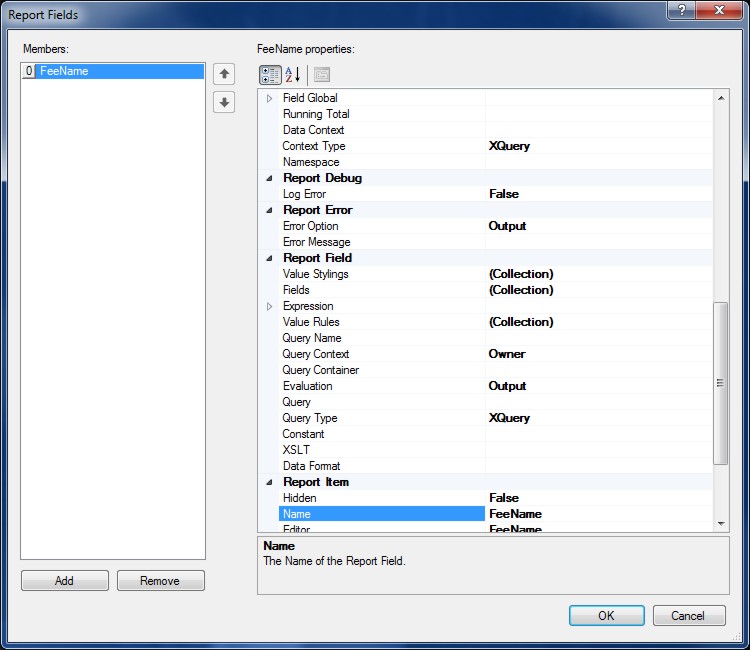
Specify a Name for the Field, Formatting and XQuery using the Property Grid.
Clicking the Query button will open the XQuery designer.
Creating an XQuery using the XQuery Designer.
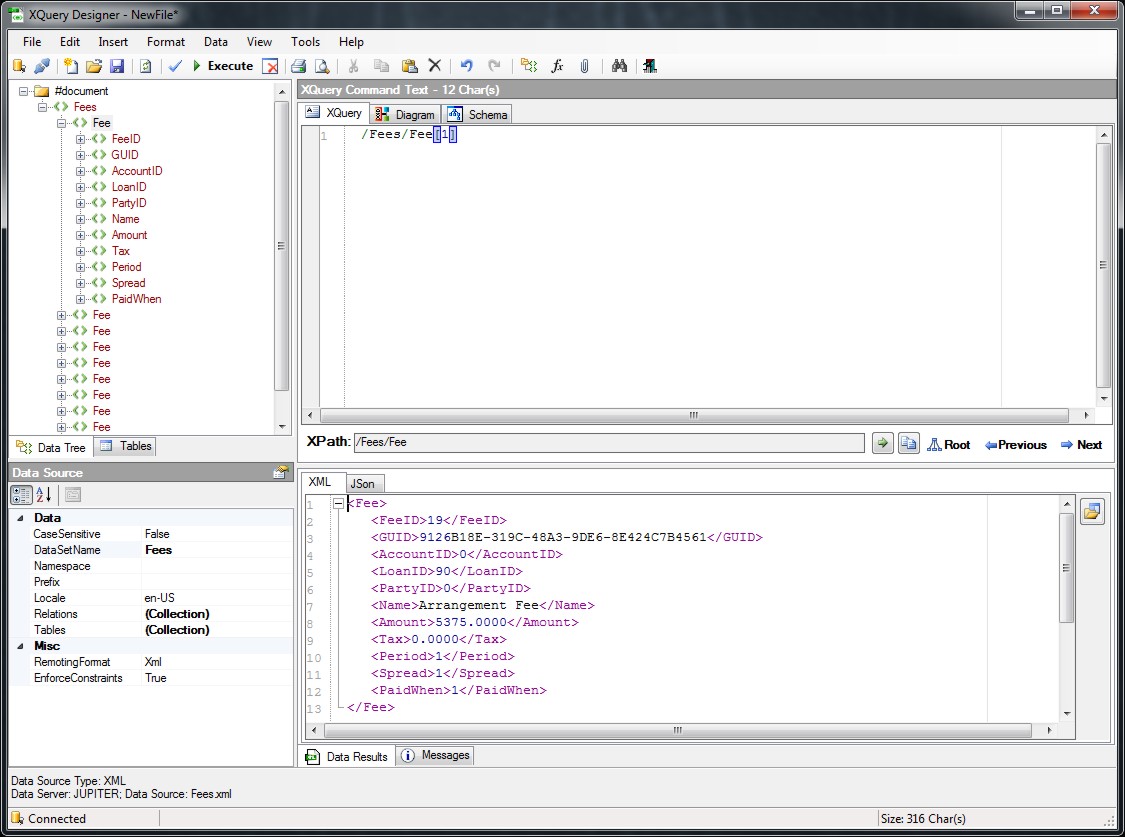
Report XML Data can be queried using XQuery / XPath. Queries are associated
with Report Fields and the output of a Query will be shown in place of the Report
Field Name. A Field Name must be specified to be recognized by the Content Editor
and the Query parser.
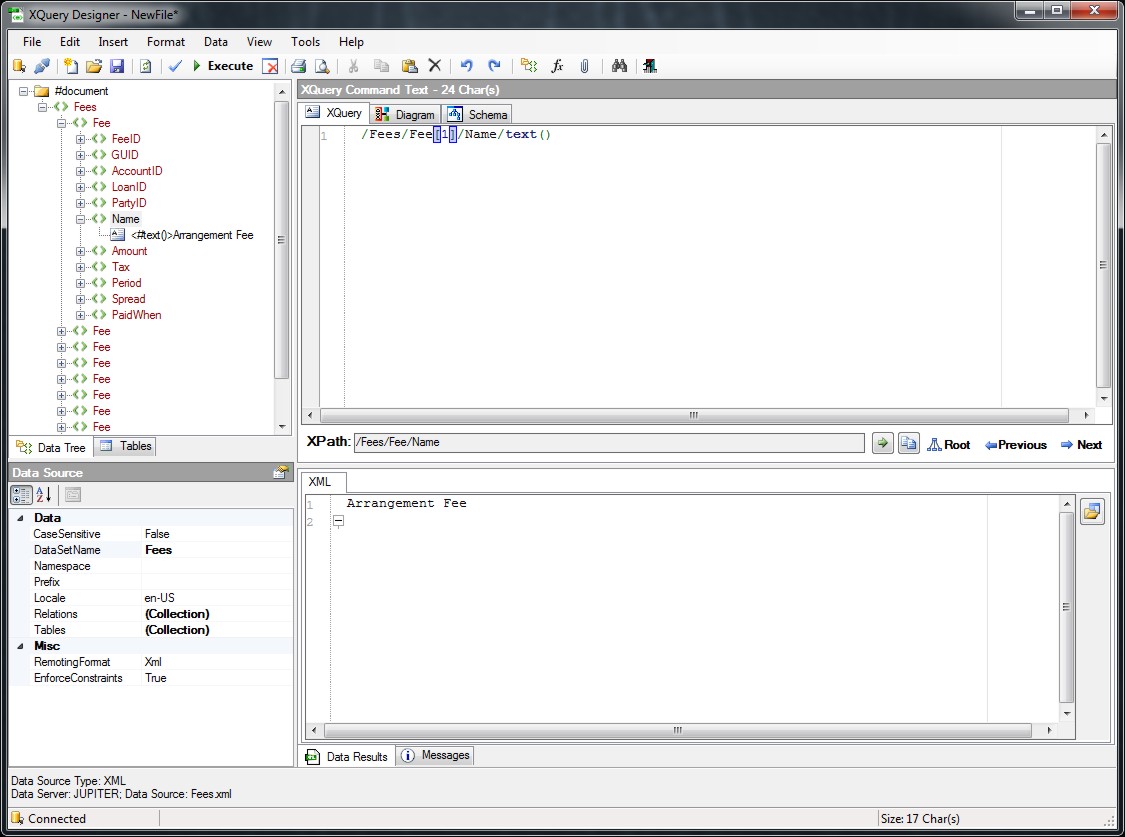
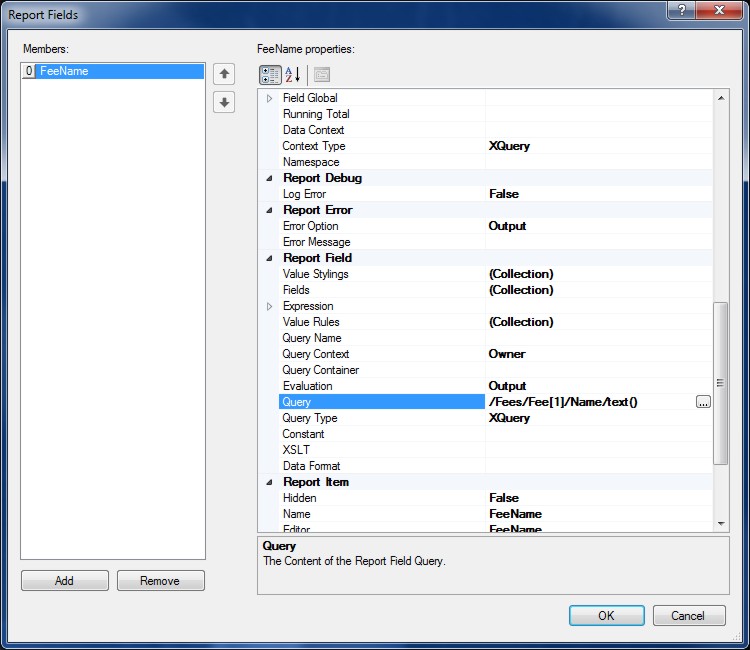
Retrieving the Name of a Fee from the report Data and displaying its output.
To display the Report Field in the Paragraph it needs to be added to the Paragraph
using the HTML Content Editor.
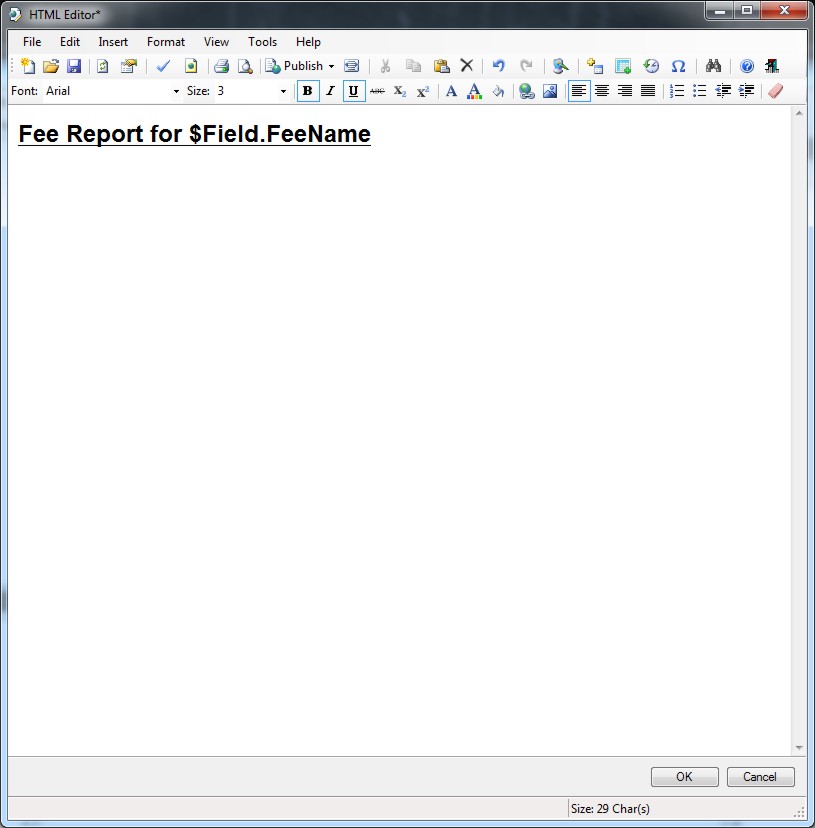
The Report Content will now display the XQuery for the Field Name.
Adding a Group to the Report
To Add or Edit a Report Group click on the Report Treeview and select the Section
or Group you wish to create Group. Report Groups are Content Sub Containers
for the Report defined in a Section Container and are a convenient way of grouping
Report Items such as Paragraphs, Tables and Charts.
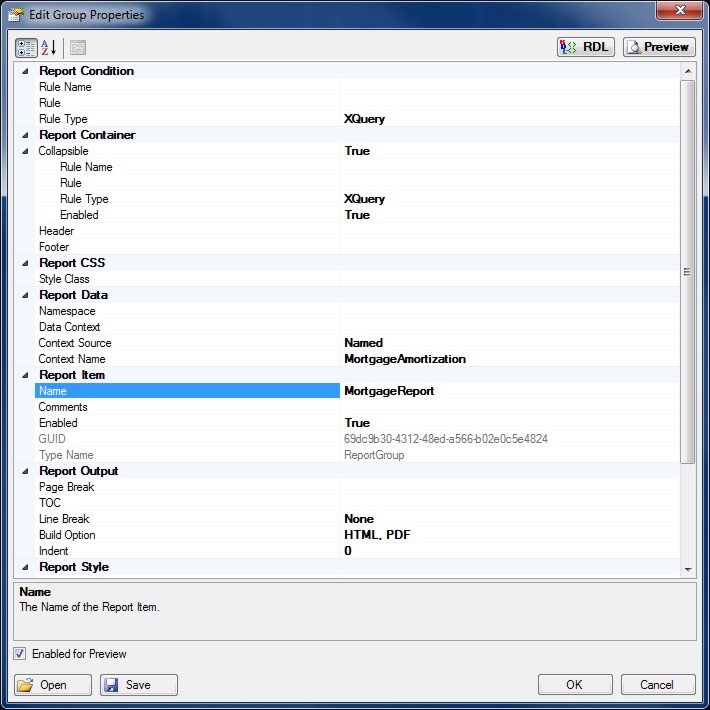
Report Groups can also contain Report Conditional Rules to determine if the
Group is displayed or not. Report Rules are XQuery expressions that return True
or False and determine if Content is Enabled. By Default if empty the Rule will
always be True.
Adding a Data Table to the Report
To Add or Edit a Report Data Table click on the Report Treeview and click Add
or Edit from the Edit Menu.
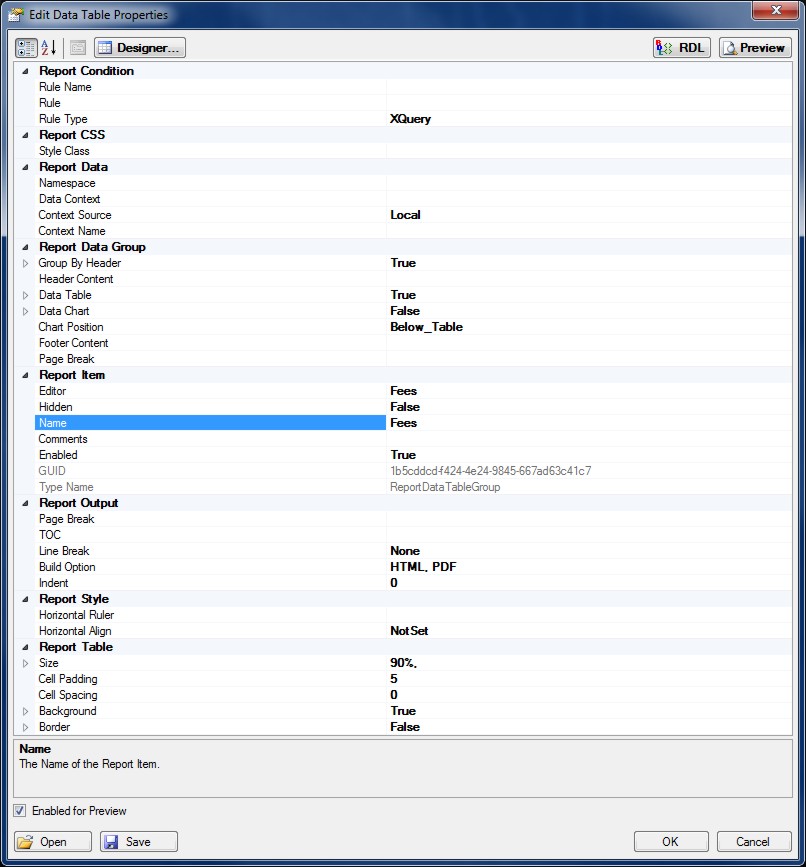
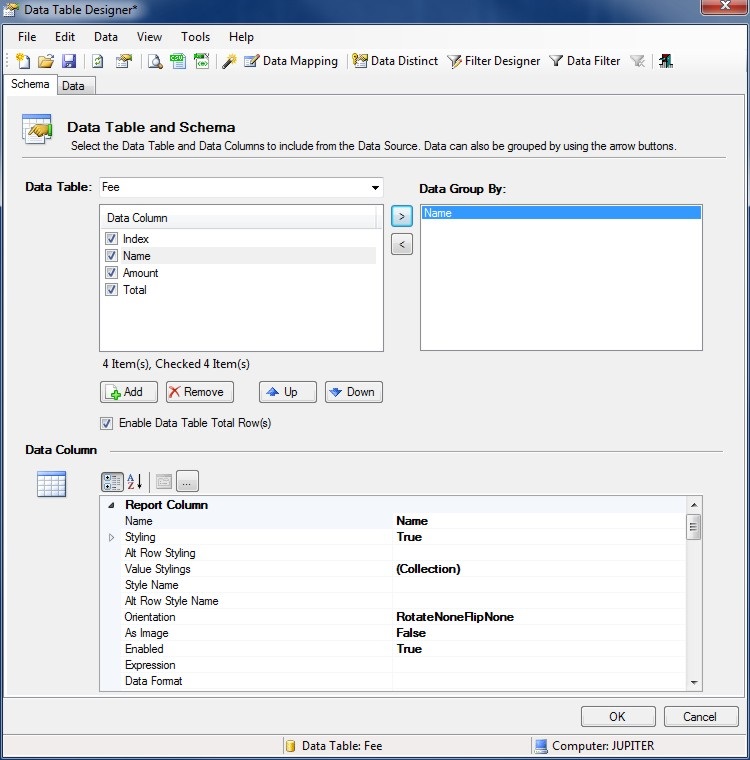
Click the Designer button to open the Report Data Table Designer.
Report Data Tables represent a Data Table in the Report Data Source. Select
the Table Name from the Drop Down list and then select the Data Columns to include
in the report and the order in which they should be presented. Data can be grouped
into sections by adding columns to the Data Group by list.
Use the Up and Down buttons to move the order in which the Columns appear in
the table.
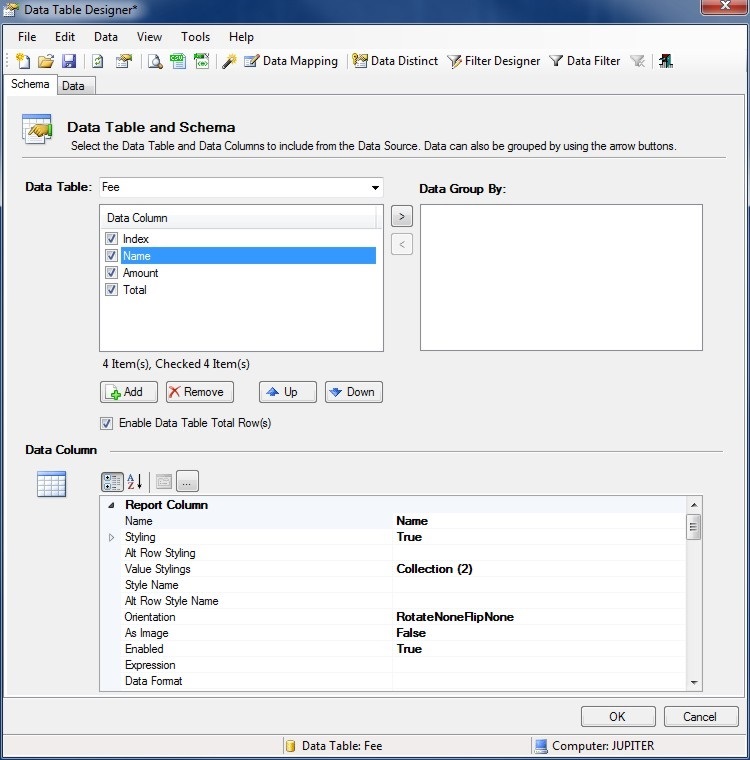
Data Table Row Limit
The number of Rows in the Data Table can be limited by specifying a Row Limit.
Open the Property Page for the Data Table Group and expand out the Properties
for the Table and enter a limit for the Data Rows.
Select Filters
Select filters can be applied to the Data Table to return even
more specific results. For example, if a Select Filter is applied for Name =
'Cool Doc Fee' then only the Fees with this Name will be output in the Data
Table.
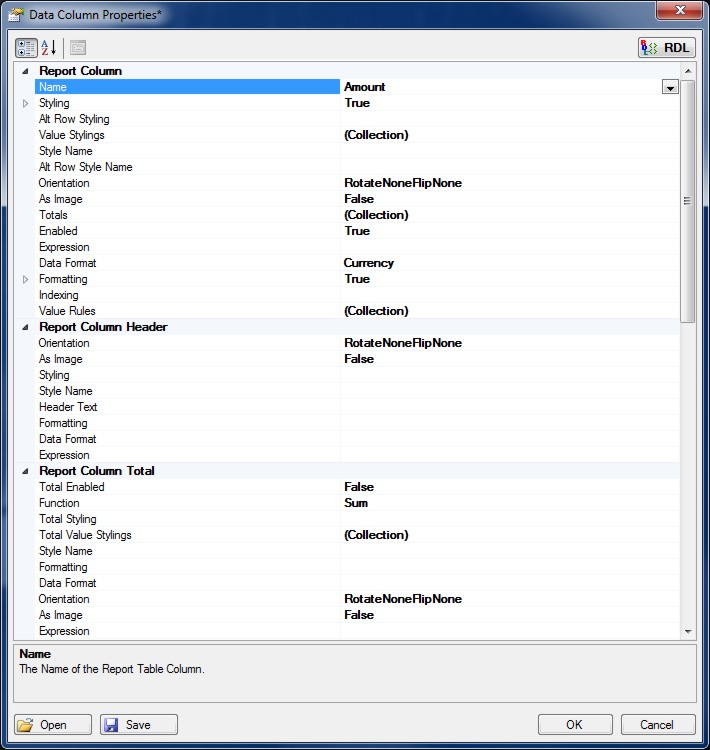
Data Column Properties
The Data Column style and format can be configured by applying settings in
the properties page.
For example a column can be specified as having a currency format with rounding
and decimal places.
Data Group Properties
Data can be grouped together and the style and formatting controlled by applying
settings to the group using the properties page.
Include a chart in the report with the Data Group by expanding the properties
and Enabling the Chart. Click the Chart Designer button to setup the Chart for
the Data Group.
Data Tables can also contain Report Conditional Rules to determine if the Data
Table or Column is displayed or not. Report Rules are XQuery expressions that
return True or False and determine if Content is Enabled. By Default if empty
the Rule will always be True.
Adding Charts to the Report
A graph or chart is a diagrammatic illustration of a set of data. Data can
be easily presented in a visual and meaningful format using the Indigo DQM Chart
Designer.
To Add or Edit a Report Chart click on the Report Treeview and select the Section
or Group you wish to create Chart in.
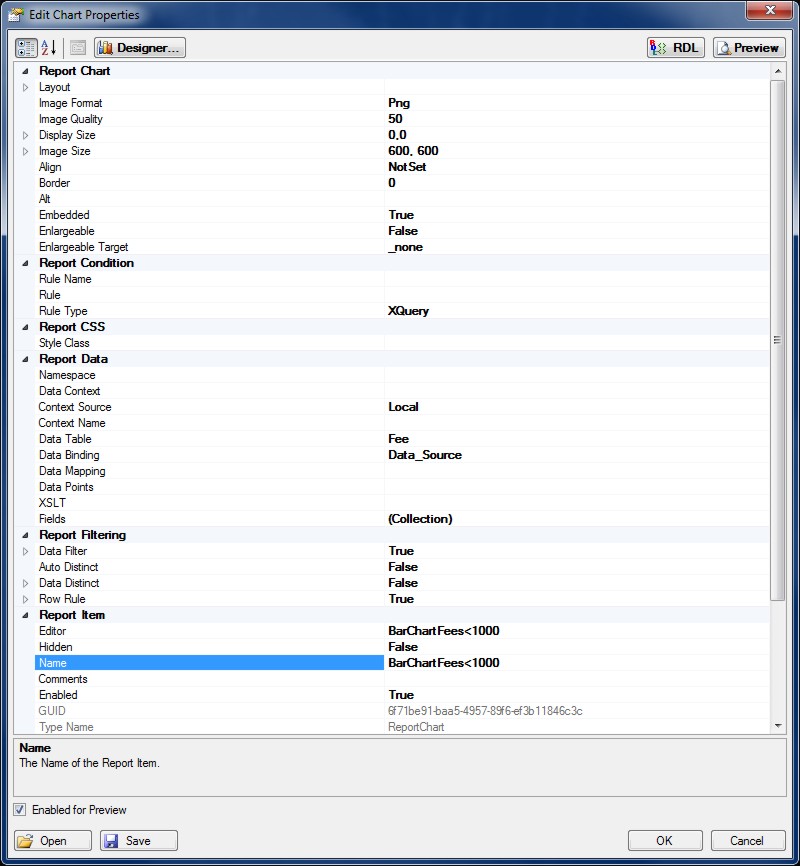
Enter the Name, Rules and Size for the Chart and then open the Designer.
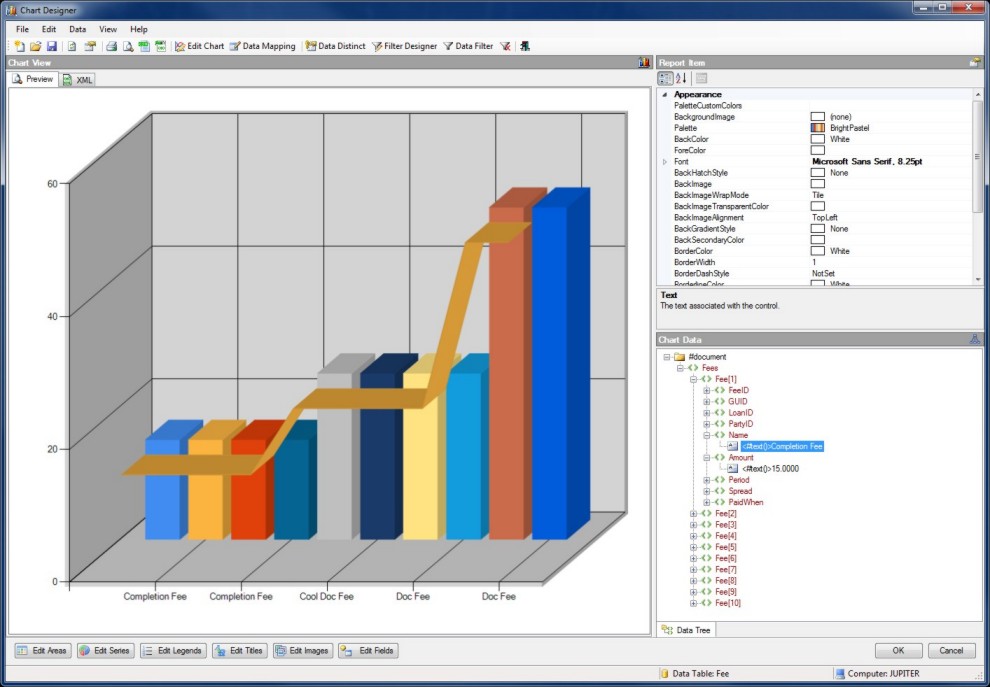
The Chart designer allows the Chart Areas, Legends and Series to be defined
using the Property Pages. The Chart should be bound to the report data source
and the available Columns from the Data Table should be selectable.
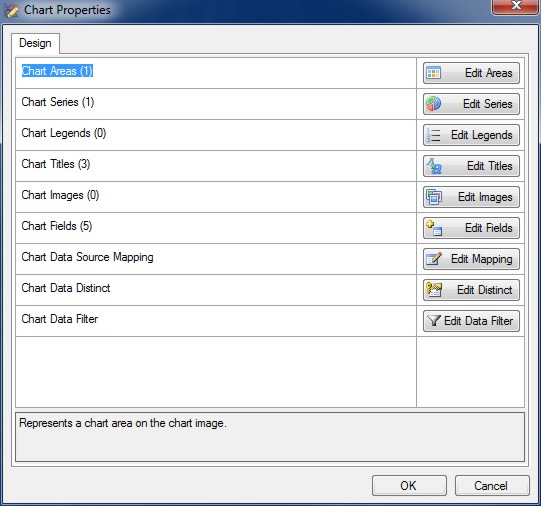
Click the Chart Series collection editor to define the Chart Series and styles.
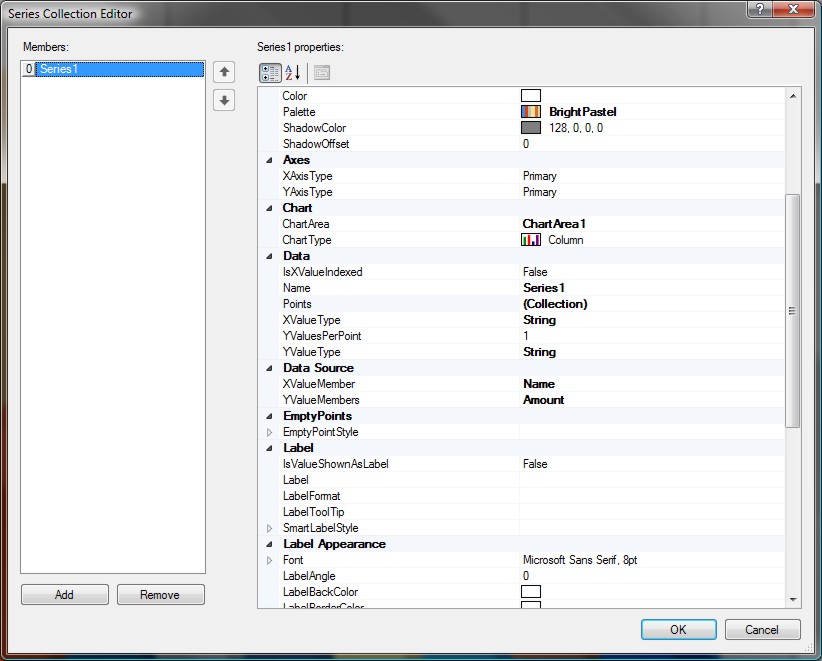
Select the X and Y Axis Data Source and Chart Type. Many other setting can
be defined to customise the Chart appearance and style.
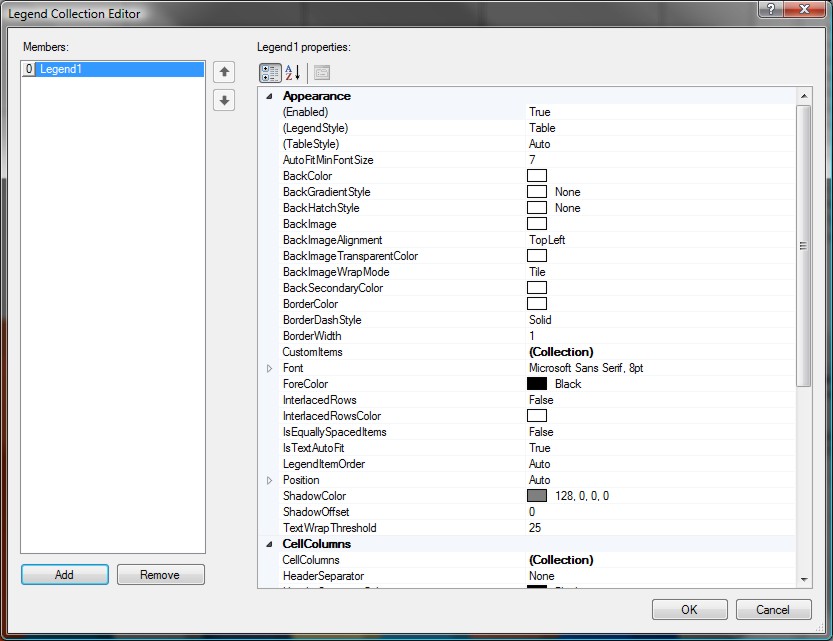
Adding Legends to the Chart is easy with the Legend Collection Editor.
Inserting a Line Chart into the Report
The following report shows the share prices for IBM and took less than five
minutes to create.
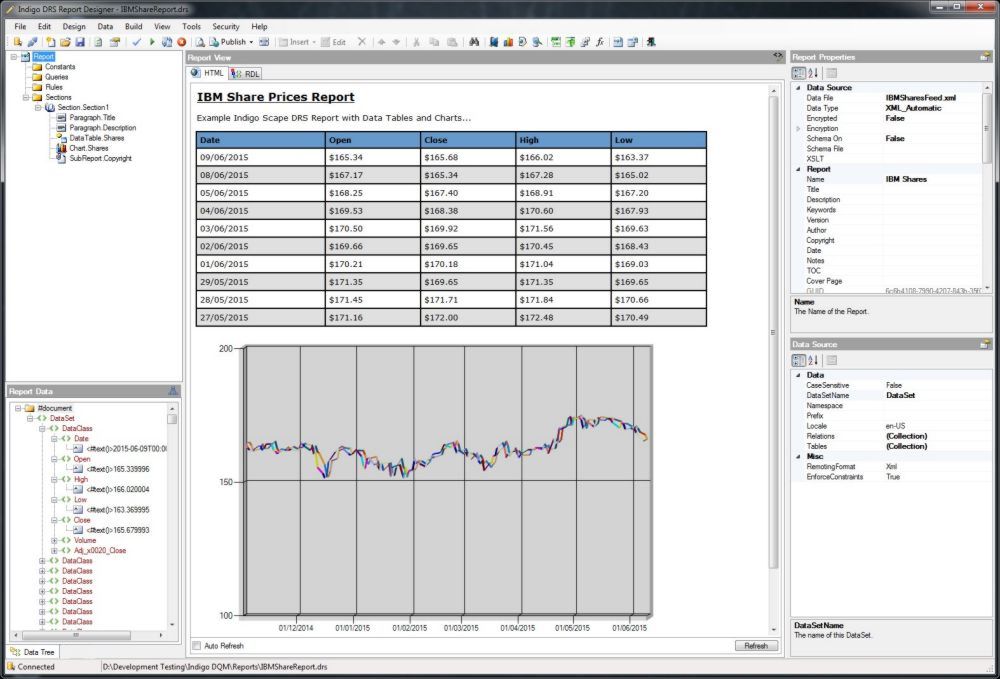
Various options are included to allow the appearance and style of the HTML
report to be customised.
Report Charts can also contain Report Conditional Rules to determine if the
Chart is displayed or not. Report Rules are XQuery expressions that return True
or False and determine if Content is Enabled. By Default if empty the Rule will
always be True.
 Return to Articles Return to Articles
|