Report Images can be pictures, shapes, drawings, gauges, Barcodes, QR Codes or shared Report Resources.
To add or edit a Report Image click on the Report Designer tree-view and select a Report Section or Report Group and then click the menu Edit | New, Insert or Edit Image.

Click the File URI (...) button to select the location for the Report Image and enter the details and size for the Report Image or leave the size blank for auto sizing.
The Build Option property controls the output of the Report by including the content in HTML and / or PDF builds.
Report Image Shapes
Report Images can be also be shapes in the form of rectangles, circles, triangles, hexagons or gauges. Shapes can also be styled with text, borders, hatching, gradients and backgrounds.
To specify the Report Image as a shape change the Image Type from 'Picture' to 'Shape'.

Expand the Report Shape properties or click the Shape Editor button next to the Shape property to alter and customise the shape design.

Report Shape Images are a powerful graphical enhancement to the Report appearance and can also be applied to Report Paragraphs and Tables.
Report Gauges
Report Gauges allow Data to be summarized in a visual format. Gauges can be styled with captions and ranges.
Click the Gauge button on the property grid to open the Gauge Editor.

Add a caption to the Report Gauge and specify the position, color, font and text. Multiple ranges can be added to the gauge to indicate limits etc.
There many options to customise the appearance to suit many different styles including arc styles, ticks, needle color, scale lines and numbers.
The Report Gauge Value can be set as a 'Literal' or a 'Query'. If the Value Type is a 'Literal' the Gauge Value will be determined from the Value property. If the Value Type is 'Query' the Gauge Value will be determined from the Query property. The Gauge Query can be a series of XQuery or Python expressions to query the Report Data Source.
Report Barcodes
Report Barcodes represent data by varying the widths and spacings of parallel lines. Barcodes, now commonly referred to as linear or one-dimensional (1D), can be scanned by special optical scanners, called barcode readers.

Report QR Codes
Report QR Codes (Quick Response code) is a type of matrix barcode (or two-dimensional barcode) first designed in for the automotive industry in Japan and is a machine-readable optical label that contains information about the item to which it is attached.
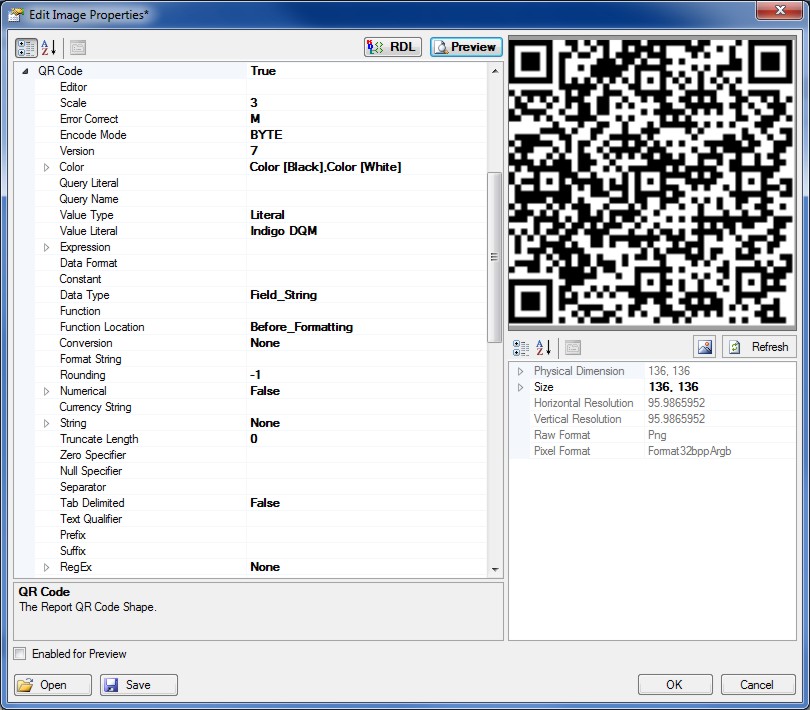
In practice, QR codes often contain data for a locator, identifier, or tracker that points to a website or application. A QR code uses four standardized encoding modes (numeric, alphanumeric, byte/binary, and kanji) to store data efficiently; extensions may also be used.
Report Images can also be shared Report Resources embedded as Base64 Data in the Report or a File. This is useful for sharing a commonly used content throughout a Report or to include the Report Images within the Report without having to include the Image File. Click the Images button on the Report properties to add / edit Report Images.
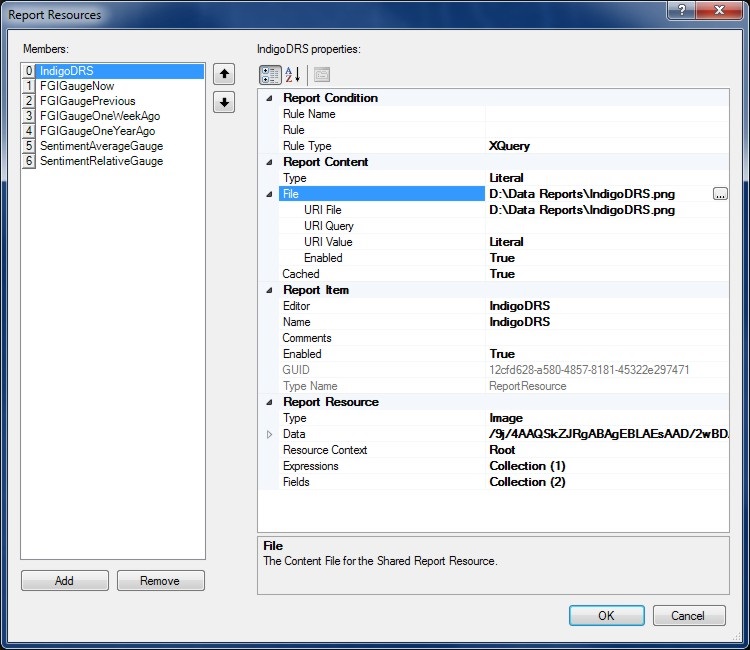
Clicking the Base64 button to open the Base64 Image. Open an Image File or Base64 Data and a preview of the Report Image will be shown.

Click OK to add the Image. The Report Image will be available in the drop-down list for the Resource Name property. Select the Image Type property as Resource.
File URI's
Report File URI's are expressed as Uniform Resource Identifiers (URI) and can be either a Literal or a Query to specify the location of the File Resource. Literal values are constants that are determined by the URI File property.
Query based URI's are determined by the result of the URI Query which can be a series of XQuery or Python statements to specify the location of the File URI.
Report Rules are conditional XQuery or Python expressions that determine if Report content is enabled and applied to the build. Rule based queries return a Boolean that is either True or False and can query the Report Data Source and other Report Data Contexts. Rules are used for controlling the flow, visibility and activation of reporting content.
Report Rules if empty or null by default will always return True.
Report Namespaces are used for providing uniquely named elements and attributes and is a mechanism to avoid name conflicts by differentiating elements or attributes within an XML document that may have identical names, but different definitions. If the Report Data Source contains namespaces they can be applied to the XQuery Processor.